Phase 1: 1st place in both the Single-Task and Multi-Task tracks.
Core recipe: full-weight fine-tune the π0.5 backbone with global batch size 128 in Phase 1, then 256 in Phase 2, using all available non-failure data without data-type-specific loss weighting.
Main findings: HIL recovery data and task-specific reset removal appeared useful in our development; the evaluated generic curation methods did not produce large gains.
Abstract
We report our solution for the RSS 2026 Post-Training for Robotics Foundation Models Challenge. We retained the official π0.5-style architecture and used full-weight fine-tuning with a uniform imitation-learning loss on all available non-failure data. Phase 1 used four 80 GB NVIDIA A100 GPUs and global batch size 128; our submission ranked first in both tracks, with average progress scores of 82.0 (Single-Task) and 68.7 (Multi-Task), compared with 60.3 and 52.3 for the official pi05 reference policy [11]. HIL recovery behavior and removal of post-success reset segments appeared useful in our development, whereas the curation methods we evaluated did not yield large gains under limited evaluation. In Phase 2, we continued full-weight fine-tuning from the Phase 1 checkpoints with eight 80 GB A100 GPUs and global batch size 256, using all 808 released rollout episodes; the seal-water-bottle-cap data received the same reset removal, while the insert-mouse-battery policy remained unchanged because its Phase 2 training did not finish before submission. Phase 2 evaluation yielded average progress scores of 67.3 for the generalist policy and 74.3 for the specialist policies.
1. Problem Setup
1.1 Problem setting and challenge phases
The Post-Training for Robotics Foundation Models Challenge studies how a pretrained robot policy can be improved using real interaction data, including successes, failures, and human corrections. Policies are evaluated on standardized real-robot bimanual manipulation tasks. The challenge has two rounds: in Phase 1, teams train offline on the released dataset and submit either task-specific policies to the Single-Task track or one shared policy to the Multi-Task track. In Phase 2, the top three teams from Phase 1 deploy their own policies, collect additional rollouts with organizer support, and iteratively post-train improved policies. Ranking is by Average Success Rate first, with Average Progress Score as the tie-breaker [1].
1.2 Benchmark tasks
Task
Goal and progress scoring
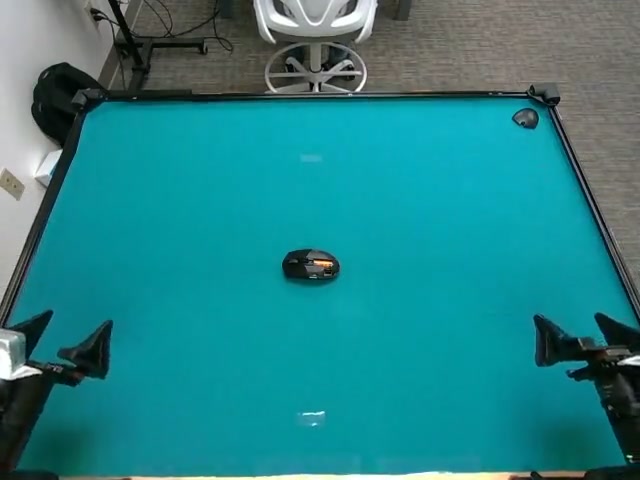
insert-mouse-battery
Position the mouse correctly, insert the battery with the correct polarity, and fully seat it. Partial progress is credited for correct positioning and partial insertion.
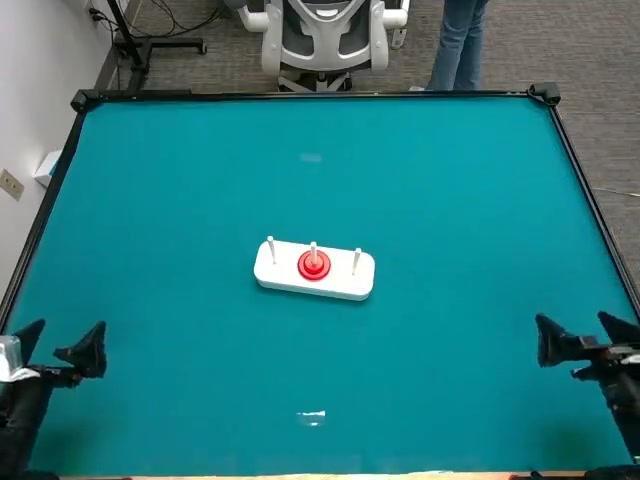
tower-of-hanoi-game
Move the small ring to the opposite peg, move the large ring to the middle peg, and finally stack the small ring on the large ring. Intermediate placements receive partial credit.
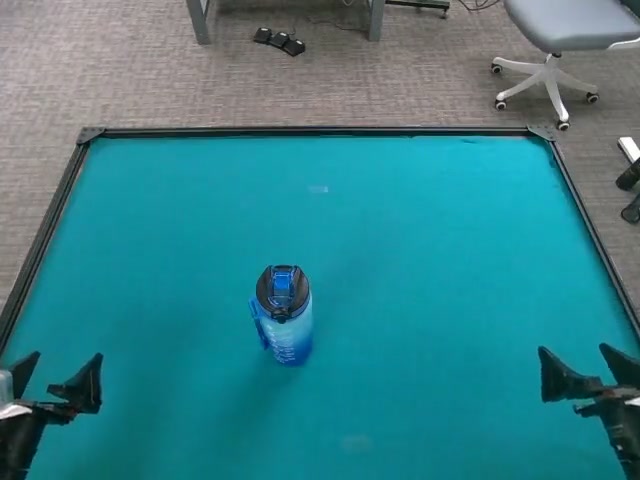
seal-water-bottle-cap
Insert the cap’s straw into the bottle, place the cap, and tighten it. The final tightening score increases with the number of turns, up to a fully tightened cap.
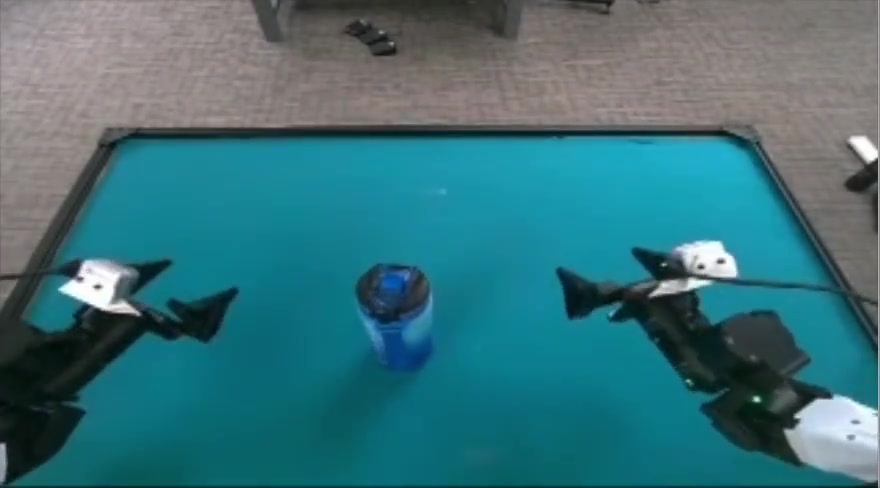
insert-mouse-battery, top view. Official challenge video [1].tower-of-hanoi-game, top view. Official challenge video [1].seal-water-bottle-cap, top view. Official challenge video [1].
1.3 Released dataset
The standardized Phase 1 dataset is provided in LeRobot format for offline training and contains four complementary sources.
Dataset component
Description
Role in post-training
Expert data
High-quality human teleoperation demonstrations for the benchmark tasks.
Provides clean task-completion behavior.
Baseline success rollouts
Trajectories in which the baseline policy completes the task.
Provides successful behavior closer to the deployed policy distribution.
Baseline failure rollouts
Trajectories in which the baseline policy fails.
Available as a negative or filtering signal in the released dataset, but not used in our training mixture.
Human-in-the-loop data
Human interventions, corrections, and preference labels collected during baseline rollouts.
Provides corrective and recovery behavior after policy errors.
Release
Contents and scale
Dataset link
Phase 1
Three task directories, each split into expert-data, failure-data, and success-and-hil-data. The release contains 3,209 episodes, 8,635,032 frames, and approximately 39.9 hours of synchronized 60 Hz data. Each frame includes a 14-dimensional state and action, three RGB camera streams, and an observation.commander_state mode label. HIL and autonomous successes are stored together and distinguished by the per-frame mode.
Team-policy rollouts organized as 23 independent LeRobot v2.1 sub-datasets across the same three tasks. The release contains 808 episodes and 4,289,763 frames, covering generalist and specialist policies. Per-frame observation.commander_state labels distinguish human teleoperation from autonomous policy inference.
This mixture makes the benchmark a post-training problem rather than conventional expert-only imitation learning: a method must decide which rollout behavior should be reinforced, corrected, or removed. The Phase 2 release then provides newly collected on-policy and HIL rollouts from the selected teams.
2. Phase 1 Results
Track
Rank
Our average score
Official pi05 baseline
Gain
Average success rate
Single-Task
1st
82.0
60.3
+21.7
76.7%
Multi-Task
1st
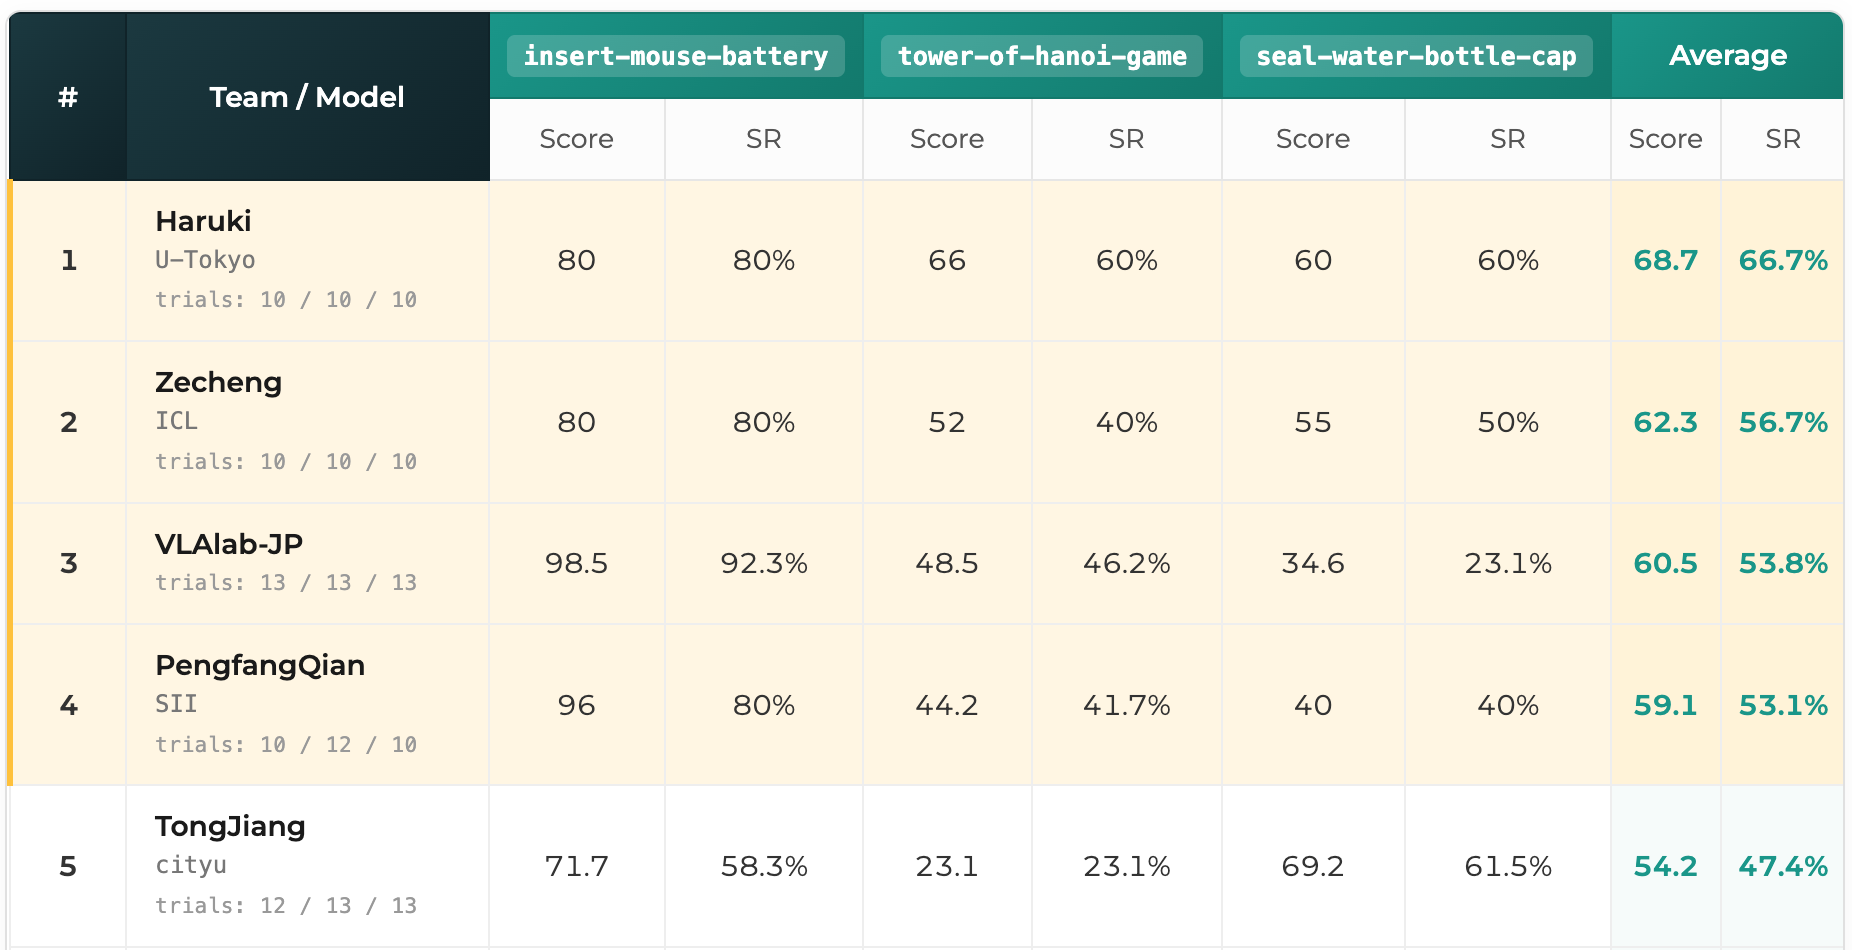
68.7
52.3
+16.4
66.7%
Scores are average progress scores. Baseline and submission results are from the official Phase 1 leaderboard [11].
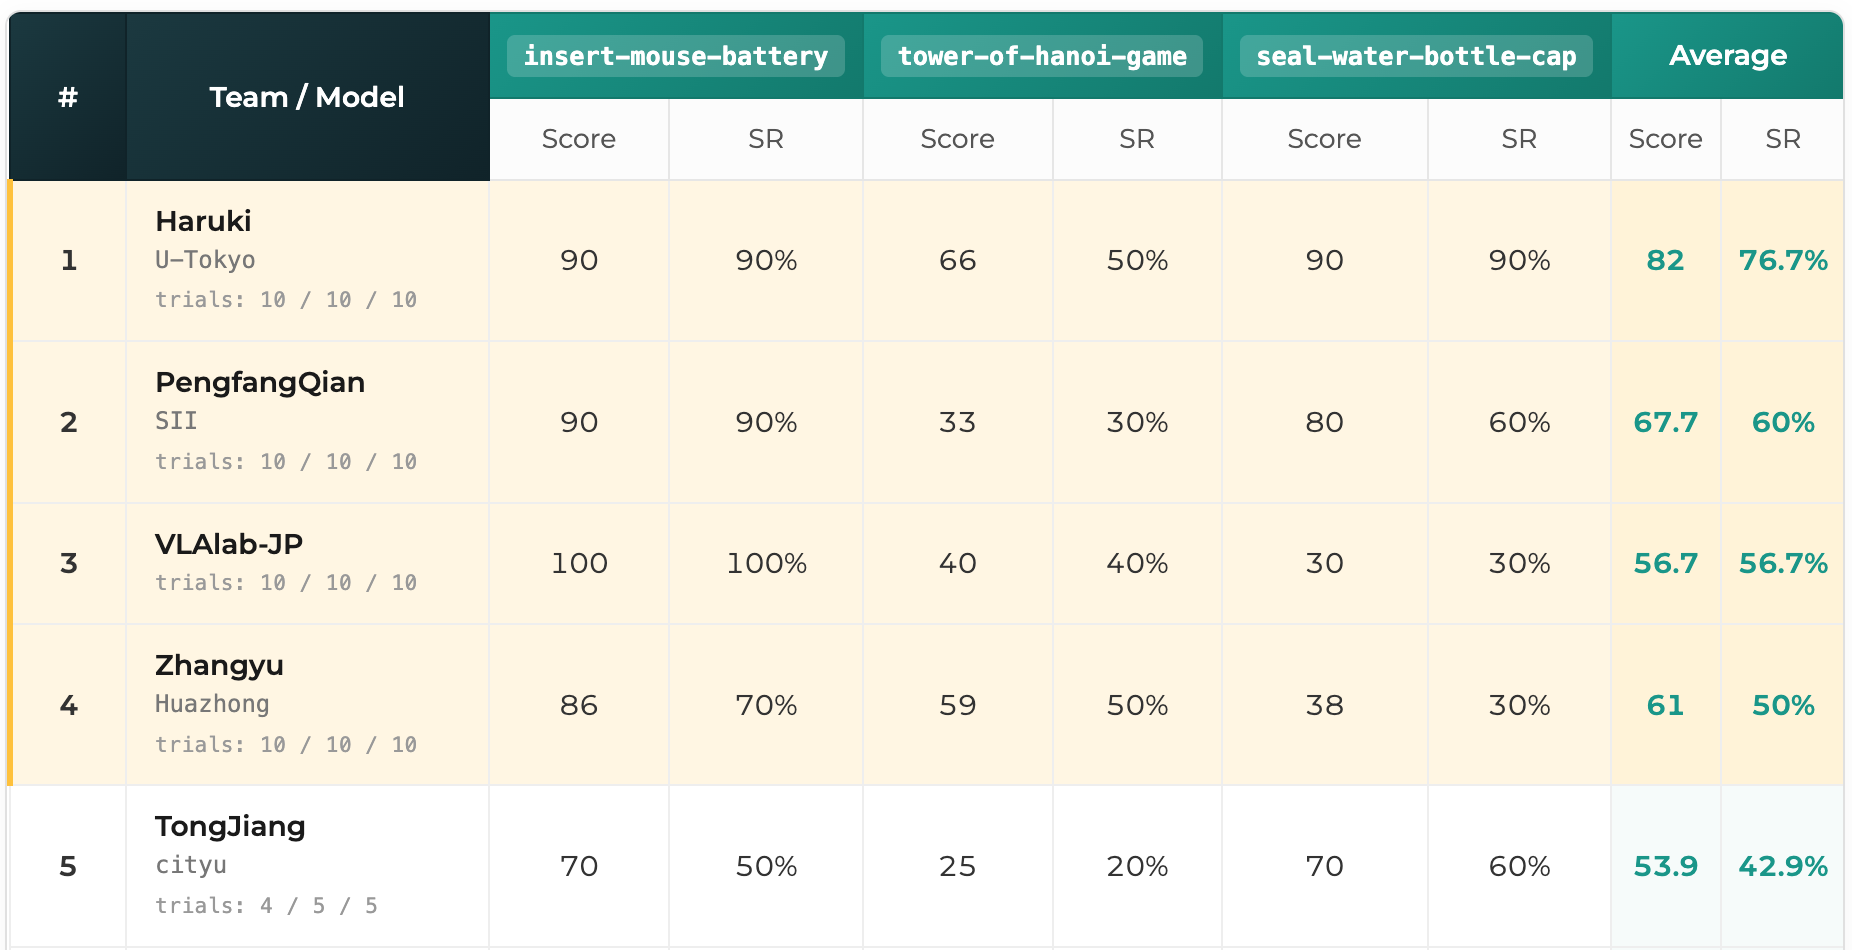
Single-Task track. Official Phase 1 leaderboard. Our submission ranked first with an average score of 82.0 and an average success rate of 76.7%.Multi-Task track. Official Phase 1 leaderboard. Our submission ranked first with an average score of 68.7 and an average success rate of 66.7%.
3. Method Overview
Summary: We did not introduce a new architecture. We used a π0.5-style baseline architecture and focused on data mixture, fine-tuning stability, HIL recovery data, and removing seal-water-bottle-cap reset behavior.
3.1 Architecture
We followed the challenge organizers’ OpenPI baseline and used its π0.5 configuration rather than introducing a new backbone [5][6]. The implementation details below are taken from the official baseline [4].
pi05_insert-mouse-battery, pi05_seal-water-bottle-cap, and pi05_tower-of-hanoi-game
Action horizon
50 steps, inherited from the default Pi0Config
Observation cameras
Three RGB views: overhead cam_high, left wrist cam_left_wrist, and right wrist cam_right_wrist; images are resized to 224 × 224 before entering the model.
State/action dimensions
14 physical dimensions: six joints plus one gripper value for each arm. OpenPI pads state and action tensors to the model’s 32-dimensional action space; joint actions are represented as deltas while gripper commands remain absolute.
3.2 Data mixture
We used all available non-failure data: expert demonstrations, baseline success rollouts, and HIL trajectories. We excluded the baseline failure rollouts and one expert trajectory that contained failure behavior. All retained samples used the same imitation-learning objective; we did not assign different loss weights by data type.
3.3 Optimization
We inherited the official OpenPI challenge baseline optimization recipe except for the global batch size and the number of training steps [4]. Both the generalist and specialist policies were full-weight fine-tuned. The exact training durations, checkpoint initialization, batch sizes, and hardware are listed in Sections 4.1 and 8.2.
4. What Worked
4.1 Large-batch fine-tuning
We used relatively large-batch fine-tuning. Our motivation was practical: heterogeneous rollout data produces high-variance updates when batches are small, especially when each batch may overrepresent a particular task phase or recovery pattern. Larger batches provide a more stable estimate of the gradient and make it easier to mix expert, success, and HIL behavior in each update.
The official OpenPI challenge baseline uses a global batch size of 32. For Phase 1, we used a global batch size of 128—a 4× increase—on four 80 GB NVIDIA A100 GPUs. For Phase 2, we used a global batch size of 256—an 8× increase—on eight 80 GB A100 GPUs. Both the generalist and specialist policies used full-weight fine-tuning. The larger batches appeared practical in our development because the training data was heterogeneous: expert demonstrations, success rollouts, HIL corrections, and task-specific behavior phases were mixed together. With small batches, updates can be dominated by a narrow subset of this mixture.
Configuration
Global batch size
Relative to baseline
Training resources
Official OpenPI challenge baseline
32
1×
—
Our Phase 1 recipe
128
4×
4 × NVIDIA A100 80 GB
Our Phase 2 recipe
256
8×
8 × NVIDIA A100 80 GB
This choice is consistent with several strands of prior work. General large-batch optimization studies show that batch size can be increased without necessarily sacrificing data efficiency up to a task-dependent critical batch size [9], and that increasing batch size can play a role similar to reducing learning rate by lowering gradient noise [10]. More directly, the Heterogeneous Pre-trained Transformers (HPT) study reports that increasing batch size generally improved heterogeneous robot-policy pre-training until convergence, and hypothesizes that large batches reduce the variance caused by mixing heterogeneous datasets. HPT used batch sizes from 256 to 2,048 in its scaling experiments [8]. The RLDX-1 batch-size ablation likewise compares global batch sizes 64, 256, and 1,024: RoboCasa Kitchen performance increases from 66.9 to 69.6 to 70.6, while GR-1 Tabletop increases from 36.8 to 53.2 to 58.7 [7].
For Phase 1, we full-weight fine-tuned the generalist policy for 190K steps, the insert-mouse-battery and tower-of-hanoi-game specialists for 50K steps each, and the seal-water-bottle-cap specialist for 100K steps. We phrase the batch-size choice as an empirical observation rather than a universal claim: the useful batch size should depend on dataset size, model scale, learning rate, and action representation.
4.2 HIL data for recovery
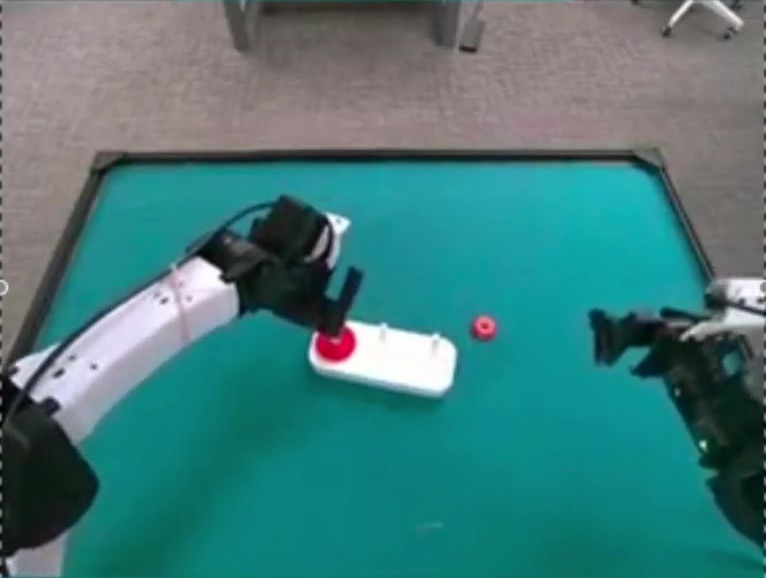
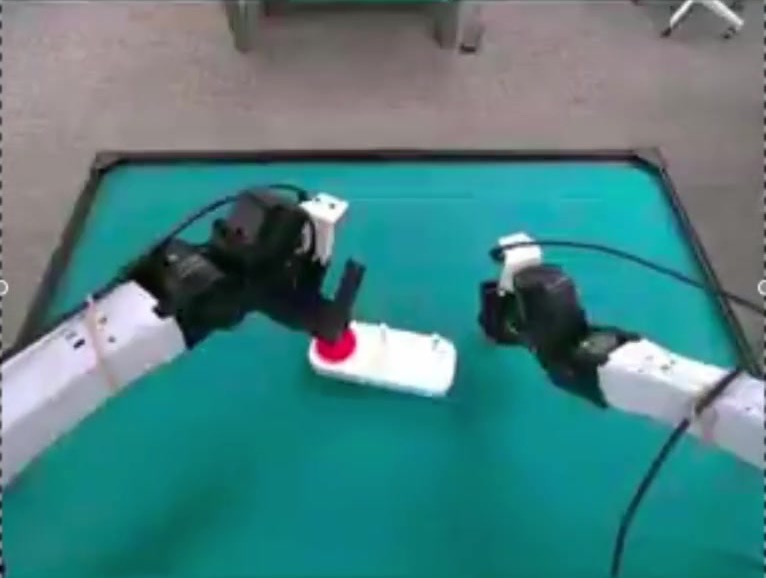
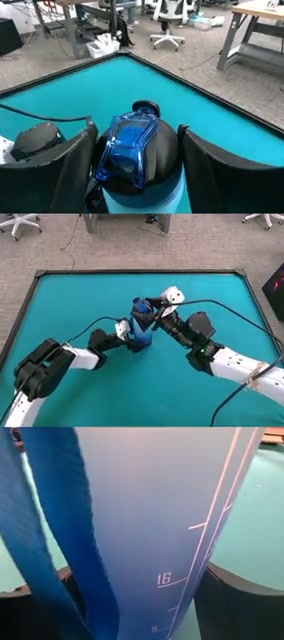
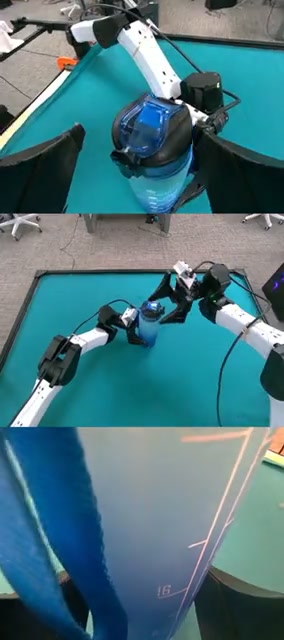
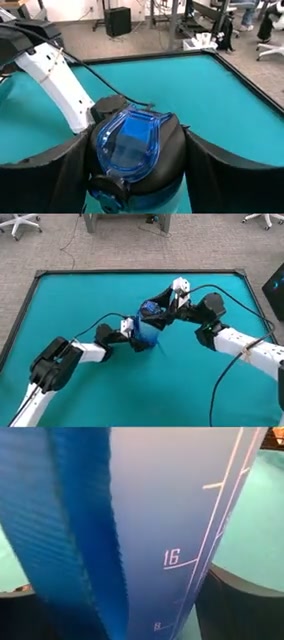
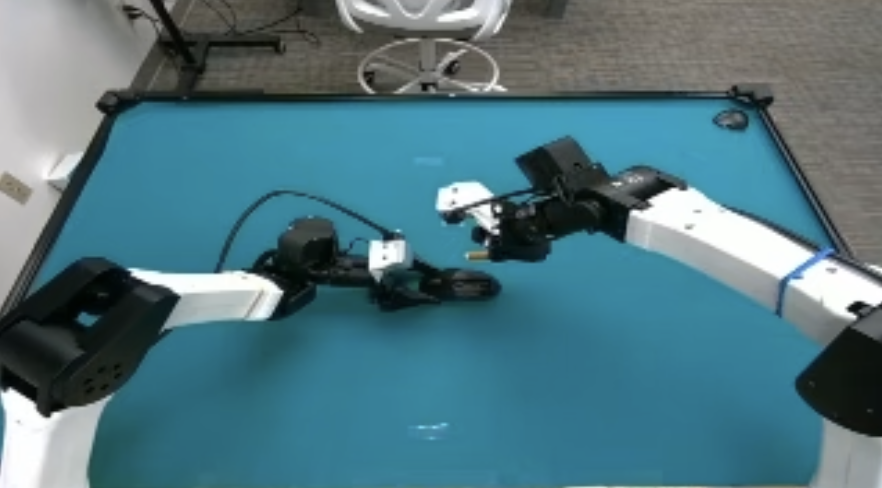
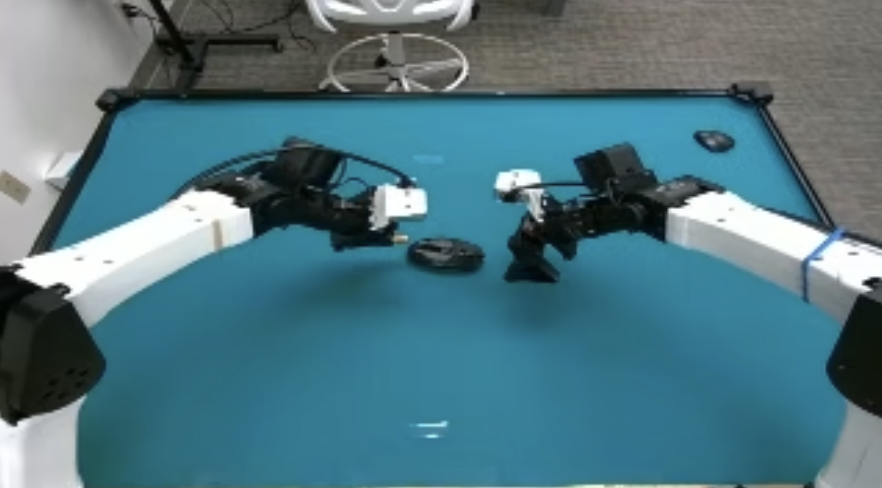
HIL data appeared useful in our development when it contained behavior after realistic rollout errors. tower-of-hanoi-game is the clearest example. In clean demonstrations, the ring is ideally inserted into the peg. In real rollouts, insertion can fail, the ring can fall or roll, and the robot must recover by re-grasping and retrying. Training on HIL trajectories exposed the policy to these recoverable states.
Failure state. The ring is displaced after an unsuccessful interaction.Recovery. The policy re-engages with the displaced ring.
This suggests that HIL data should not be viewed only as “more demonstrations.” Its value is highest when it covers the state distribution induced by the imperfect policy itself.
4.3 Removing reset behavior for seal-water-bottle-cap
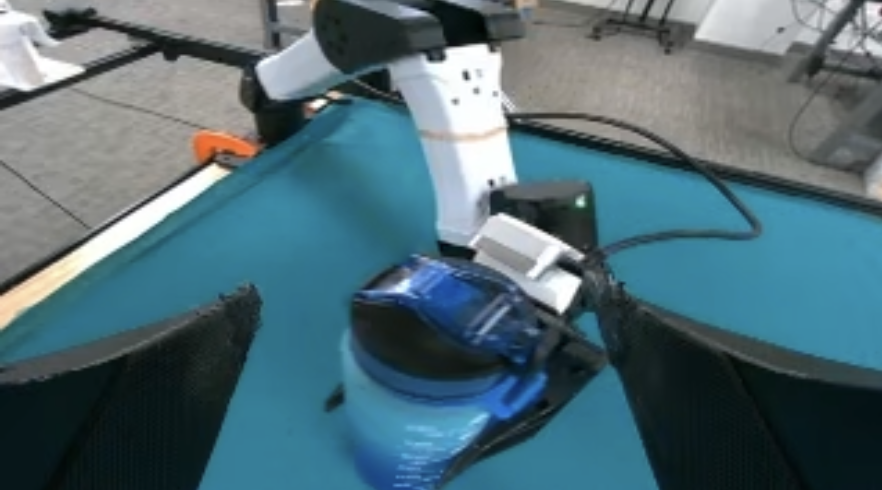
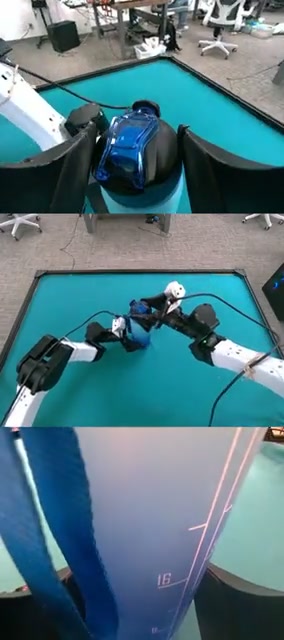
The seal-water-bottle-cap task rewards inserting the straw/cap and then tightening the cap, with the final score increasing with the number of tightening turns. From the camera observation alone, however, it is difficult to determine how tightly the cap has already been fastened: the cap, gripper, and bottle appearance changes only subtly across additional turns and is partially occluded during manipulation.
Visual ambiguity in seal-water-bottle-cap. A task-execution camera frame provides little direct evidence of the current cap tightness or how many additional turns remain.
In the original trajectories, cap tightening is followed by a post-success reset behavior, shown first below. Because the policy cannot reliably infer tightness from the image, this transition can teach it to stop tightening or undo progress.
1. Post-success reset behavior (2× speed). After cap tightening is complete, the trajectory transitions into reset. We cut this segment from the training data.
2. Policy after reset removal (64× speed). The policy continues rotating the cap until the environment forces a reset. In the longest observed cases, this behavior continued for up to eight minutes.
We removed the post-success reset segment from the training data. The resulting policy continued tightening until the evaluator or environment reset the episode, as shown in the second video. This is not a general-purpose manipulation rule; it is a task- and metric-specific alignment decision.
5. What Was Less Effective
5.1 Splitting HIL trajectories at action discontinuities
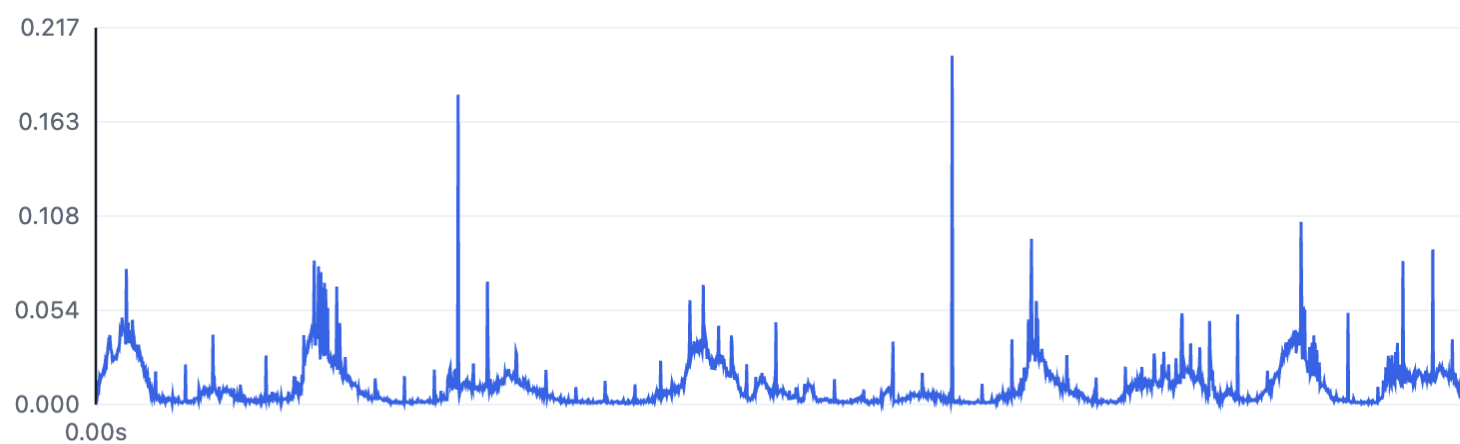
Baseline-collected HIL trajectories contained many abrupt action changes. For each timestep, we measured the maximum absolute change across action dimensions, max_d |a[t+1,d] − a[t,d]|. The resulting time series contained numerous spikes, as illustrated below. We hypothesized that these discontinuities could provide harmful temporal supervision.
Action discontinuities in baseline-collected HIL data. The horizontal axis is time; the vertical axis is max_d |a[t+1,d] − a[t,d]|. Large spikes indicate abrupt changes in at least one action dimension.
We curated the data by splitting trajectories at the detected spikes and trained with the resulting segments. Evaluation performance did not change, so we did not use this curation in the final recipe. A likely explanation is that the model tolerated these discontinuities, or that splitting removed useful temporal context while failing to address the task-level causes of errors.
5.2 Extracting human-correction segments from HIL trajectories
In an HIL trajectory, the autonomous policy typically makes a mistake before the human operator takes over. We hypothesized that behavior cloning on this pre-intervention model behavior could be harmful, even though the subsequent teleoperation segment contains a useful correction. We therefore extracted only the teleop intervals—the human-correction segments—from the HIL trajectories and trained on those segments instead of the full trajectories. Evaluation performance became slightly worse, so we did not adopt this filtering in the final recipe; the final model was trained using the full retained HIL trajectories.
5.3 Strategy unification for insert-mouse-battery
We also tried strategy unification for insert-mouse-battery. The original expert data contained 832 trajectories, but one trajectory included failure behavior and was removed, leaving 831 retained expert trajectories. These retained trajectories contained two battery-insertion strategies: insertion from the right side and insertion from the left side. We built a rule-based classifier to identify the strategy and estimated that 62 of 831 retained expert trajectories used the rarer left-side strategy. We hypothesized that unifying the demonstrations around the dominant right-side strategy would reduce multimodality in the supervision, so we removed the trajectories classified as left-side insertion.
Right-side insertion. Example from the dominant expert-data strategy retained for training.Left-side insertion. Example of the strategy detected by the rule-based classifier and removed in the strategy-unified dataset.
Evaluation performance did not change after this removal. Thus, although the classifier exposed a measurable minority strategy and the filtered dataset was more behaviorally consistent, strategy unification did not improve the evaluated policy. We therefore treat this as an insert-mouse-battery-only negative result rather than a general curation principle.
6. Limitations
No controlled ablation study: Competition-time constraints prevented systematic ablations that isolate each design choice while holding all other variables fixed.
High evaluation variance: Each setting was evaluated with only a small number of real-robot trials. The resulting variance is high, so techniques reported as not effective—such as action-discontinuity splitting, teleoperation-only HIL filtering, or strategy unification—may still be beneficial under more extensive evaluation.
Training was not run to full loss convergence: Because of the competition schedule, we could not reduce the training loss to convergence for every configuration. The effect of a technique may differ after longer optimization; for example, data curation could become useful once competing runs are fully converged.
7. Practical Takeaways
Strong post-training does not always require changing the VLA backbone. A strong pretrained policy plus the right data mixture can be highly competitive.
HIL recovery data appeared useful in our development. The most useful trajectories covered states produced by imperfect policies, not only clean task completions.
The evaluated data-curation heuristics did not yield large gains. Action-discontinuity splitting, teleoperation-only HIL filtering, and insert-mouse-battery strategy unification did not measurably improve performance under our limited evaluation.
Large-batch fine-tuning was practical in our development. It can make each update reflect the intended mixture of tasks, data sources, and behavior modes.
8. Phase 2 Method and Results
Phase 2 extends the Phase 1 policy through organizer-supported deployment, additional on-policy rollout collection, and iterative post-training. The released team rollouts are documented in the Phase 2 dataset [3]. We report the rollout composition, post-training method, and evaluation results below.
8.1 Additional rollout collection
The released Phase 2 dataset contains 23 LeRobot v2.1 sub-datasets, 808 episodes, and 4,289,763 frames recorded at 60 Hz, corresponding to approximately 19.86 hours of rollouts. These rollouts cover generalist and specialist policies across the three benchmark tasks [3].
Scope
Episodes
Frames
Approx. duration
Complete Phase 2 release
808
4,289,763
19.86 h
The Phase 2 release contains no separate failure-data subset. For every policy that completed Phase 2 post-training, we combined all 808 episodes released across participating teams with the corresponding non-failure Phase 1 mixture. All samples used the same imitation-learning objective without data-type-specific loss weights. The table below lists policy-specific processing applied to this shared data mixture.
8.2 Phase 2 post-training method
Before Phase 2, we continued Phase 1 training beyond the checkpoints used for the Phase 1 submission. These later checkpoints were used only to initialize Phase 2 post-training. For each policy that completed Phase 2 post-training, we retained the architecture and used full-weight fine-tuning. We changed the training data, increased the global batch size from 128 to 256, and used eight 80 GB NVIDIA A100 GPUs. The checkpoint step denotes the source Phase 1 checkpoint; the subsequent steps are additional Phase 2 post-training steps.
Submitted policy
Phase 2 initialization and training
Data treatment
Generalist
Initialize from the Phase 1 350K checkpoint; continue for 60K steps.
No additional processing.
tower-of-hanoi-game specialist
Initialize from the Phase 1 190K checkpoint; continue for 40K steps.
No additional processing.
seal-water-bottle-cap specialist
Initialize from the Phase 1 100K checkpoint; continue for 40K steps.
Remove post-success reset behavior using the same processing as in Phase 1.
insert-mouse-battery specialist
Phase 2 post-training did not finish before the submission deadline; submit the Phase 1 policy unchanged.
Not applicable.
8.3 Phase 2 evaluation
Each task was evaluated with 10 trials. The reported value is the average progress score across the three benchmark tasks.
Policy
Iteration
Average progress score
Generalist
Iteration 3
67.3
Specialists
Iteration 2
74.3
Despite additional Phase 2 post-training, the generalist and specialist scores were 1.4 and 7.7 points lower than their respective Phase 1 results. Given the limited number of trials and lack of controlled ablations, we cannot determine whether these differences were caused by evaluation variance, the Phase 2 data mixture, or the training configuration.
9. Future Work
In future work, we would like to investigate offline reinforcement learning methods that can make use of the baseline failure trajectories excluded from our behavior-cloning mixture. Such methods may extract learning signals from unsuccessful interactions without directly imitating the actions that caused the failures.
Acknowledgments
This work was partially supported by JST Moonshot R&D Grant Number JPMJPS2011. H.A. was supported by JST BOOST, Japan, Grant Number JPMJBS2418.
Kim et al. RLDX-1 Technical Report. arXiv:2605.03269. Includes a batch-size ablation comparing global batch sizes 64, 256, and 1,024 on simulation benchmarks. https://arxiv.org/html/2605.03269v2
Wang, L., Chen, X., Zhao, J., and He, K. Scaling Proprioceptive-Visual Learning with Heterogeneous Pre-trained Transformers. NeurIPS 2024. Paper PDF